

Gantt charts are indispensable tools in project management that visually represent project timelines, tasks, and dependencies. Gantt charts simplify task management, foster team collaboration, and enhance project visibility.
We'll explore several Gantt chart examples and their diverse applications across various project types, from dependency mapping to date shifting and resource allocation. You'll discover how Gantt charts streamline every project phase, from project planning to execution, and adaptation, making them invaluable for both simple and complex projects.
Whether you're a project manager, team lead, or collaborator, understanding how to leverage Gantt charts effectively can elevate your project management capabilities.
What is a Gantt chart?
A Gantt chart is a visual project management tool that illustrates tasks and their timelines within a project workflow. It has three parts: a list of tasks on the left and a timeline on the right, with schedule bars representing the duration of each task.
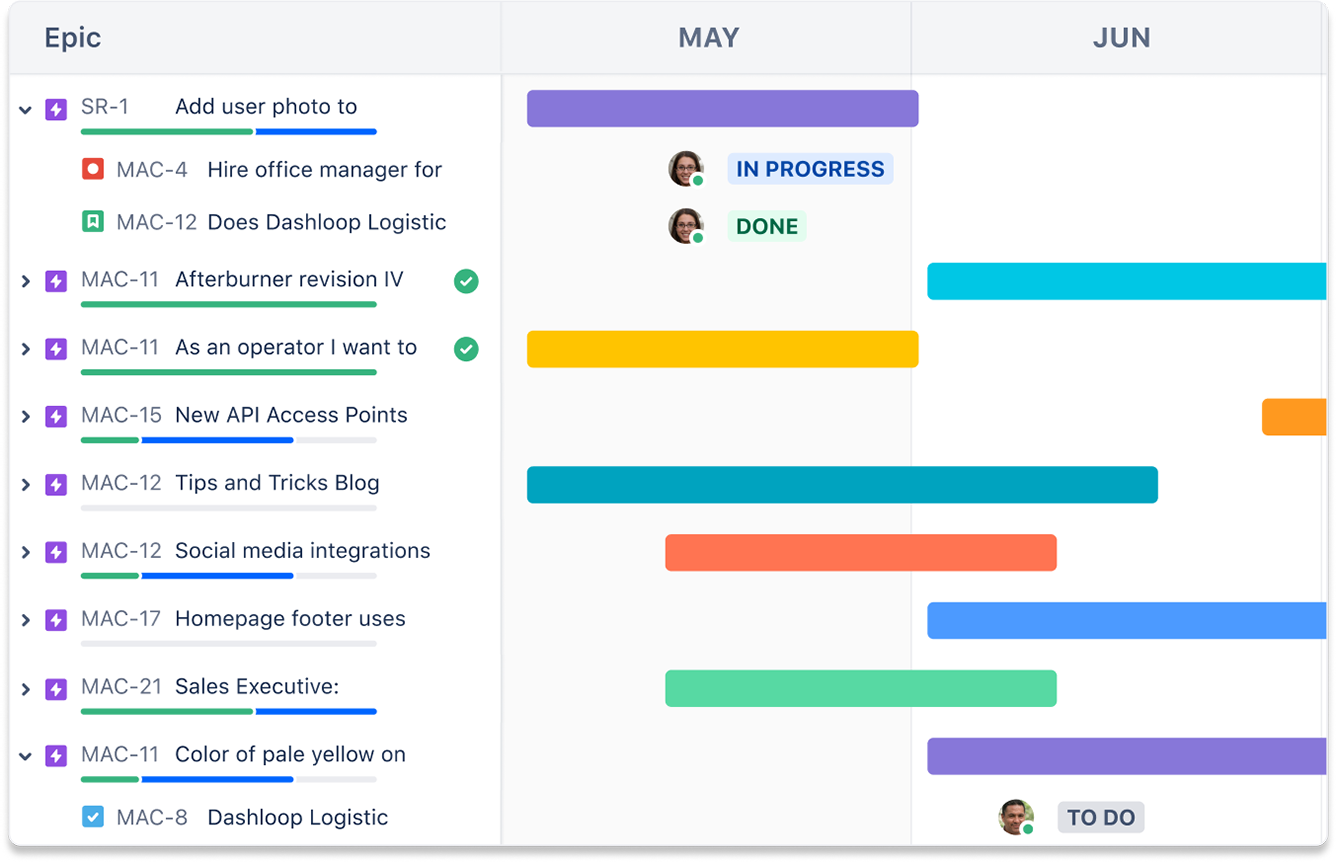
A Gantt chart example can include additional details, such as task start and end dates, milestones, task dependencies, and the individuals or teams responsible for each task. It offers a comprehensive view of a project's tasks and their sequencing, making it a valuable resource for effective project management.
5 examples of Gantt charts for project management
Gantt charts aid in planning, scheduling, and tracking projects. While versatile, their core purpose is consistent: enhancing project visibility and aiding decision-making.
Let's explore several Gantt chart examples and how they aid in managing simple and complex projects.
1. Dependency mapping
Dependency mapping is a cornerstone in project management, not only for identifying, analyzing, and documenting task interdependencies but also for prioritizing them effectively.
Gantt charts are often the go-to visual tool for this purpose, with horizontal bars indicating the duration of each task and connecting lines specifying the dependencies among them. They offer dynamic benefits like enhancing sequencing and scheduling, particularly in projects with multifaceted dependencies.
Modern Gantt chart software further elevates the practice by providing real-time updates, allowing for Agile adaptability. These charts foster team collaboration by presenting a centralized, coherent view of the project, thereby minimizing misunderstandings and closing knowledge gaps.
Example: Imagine orchestrating a large-scale cybersecurity update across multiple teams. You need to complete some tasks, such as coding the software before rolling out the update. But other tasks, like employee training, can occur in parallel. Gantt charts illustrate these complex interdependencies, empowering project managers to allocate resources optimally and proceed with a well-timed execution.
2. Task management
Gantt charts offer a structured and visual approach to planning, scheduling, and resource allocation, making them invaluable in project management.
Here are some reasons why Gantt charts excel in task management:
- Task planning provides a clear project task overview regardless of complexity.
- Task allocation allows effortless assignment to team members, promoting collaboration.
- Timelines offer precise scheduling with defined start and end dates, preventing overwork.
- Task dependencies highlight interdependencies for correct task sequencing.
-
Progress tracking helps every stakeholder keep a tab on a project’s lifecycle through a chart.
Gantt charts streamline complex task information, facilitating decision-making, promoting organization, clarifying roles, and ensuring smoother project execution.
Example: A software development sprint includes coding, testing, and debugging. Gantt charts allow developers to assign tasks precisely, setting clear timelines for each sprint. Maintaining alignment, reducing overwork risks, and tracking progress visually helps teams meet release deadlines.
3. Project planning
Gantt charts provide an all-encompassing perspective on project scope, going beyond task enumeration to deliver strategic insight. These charts act as strategic roadmaps, meticulously aligning with overarching objectives.
They serve the dual purpose of guiding immediate action and facilitating long-term planning. Their high-level timelines are tailored for diverse project scales, from short-term bursts of activity to long-term strategic initiatives, offering stakeholders a robust framework for decision-making and resource allocation.
Beyond this, Gantt charts break down tasks into manageable steps, assigning ownership and establishing logical sequences. This task breakdown enhances resource optimization and accountability, while identifying dependencies ensures smooth project progress.
Gantt charts empower project planners to plan, visualize, and execute projects, making them invaluable for comprehensive project views, roadmap creation, and efficient task management.
Example: Marketing campaigns require the project team to juggle multiple tasks, such as market research, content creation, and campaign execution. Gantt charts serve as a visual roadmap for breaking down these tasks, assigning them to team members, and setting clear deadlines.
4. Date shifting
Gantt charts are versatile tools for managing project timelines and adapting to dynamic situations. They excel in date shifting, allowing you to add specific due dates for task alignment and clarity.
When adjustments are necessary, Gantt charts simplify the process with a user-friendly drag-and-drop feature, ensuring task flexibility. They also help manage scheduling delays by visualizing their impacts and enabling resource reallocation and schedule modifications.
During resource conflicts or unexpected emergencies, Gantt charts facilitate swift responses, providing the tools for task reassignment or deadline extensions. These capabilities make Gantt charts a reliable compass for navigating unexpected changes while keeping your project on course.
Example: Supply chain issues may delay a product launch. Using a Gantt chart, project managers can easily adjust the dates for dependent tasks, such as marketing and distribution. Adaptability minimizes the impact of delays and keeps the project on schedule.
5. Resource allocation
Resource allocation is a cornerstone of effective project management, and Gantt charts are instrumental in this process. Here's how to use Gantt charts for resource allocation:
- Identifying resource needs: Gantt charts document resource requirements, associating them with tasks or milestones for clarity.
- Checking availability: Gantt charts align resource timelines with project schedules, identifying conflicts and enabling adjustments.
- Managing constraints: Gantt charts accommodate limitations, such as working hours, allowing parameter definition for adherence.
- Optimizing usage: The visual representation of Gantt charts helps identify underutilization or overallocation, enabling task adjustments.
Example: Academic research projects use various resources, such as research assistants, lab equipment, and computing power. Gantt charts can determine when a project needs each resource, identify their availability, and optimize resource usage by avoiding bottlenecks.
A good Gantt chart example serves as a professional framework for resource allocation, ensuring judicious resource deployment, reducing bottlenecks, enhancing productivity, and achieving project goals within set timelines and budgets. Try out our Gantt Chart Template and get started managing your next project today!
Jira for software teams
Trusted by millions of high-performing agile teams, Jira is the leading project management tool for software development. It serves as a central hub throughout the development cycle, enabling effective planning, tracking, and release management.
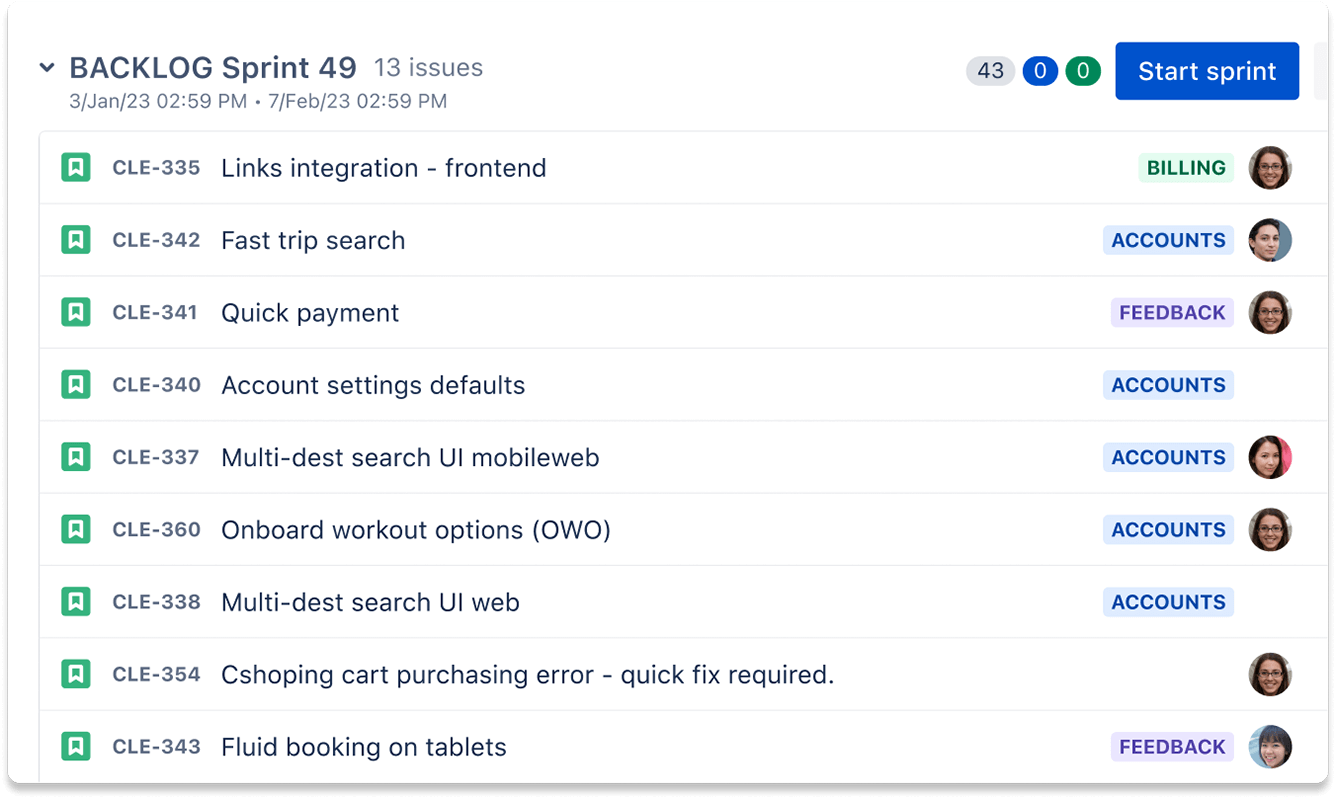
Jira emphasizes the product backlog, prioritizing tasks from the project roadmap. This ensures high-priority items are at the forefront, enhancing development efficiency.
As an alternative to Gantt charts, teams can select tasks based on capacity using continuous flow (Kanban) or structured iterations (Scrum), aligning work with capabilities and improving responsiveness. While Gantt charts provide a visual representation of a project timeline with dependencies, Jira’s backlogs and timelines offer dynamic adaptability, accommodating change swiftly.
Jira for business teams
Jira is a valuable solution for diverse business teams, promoting seamless collaboration and efficient project delivery. Tailored for business teams such as marketing, operations, sales, and HR, Jira offers a user-friendly interface. For project planning, Jira uses dynamic calendars instead of traditional Gantt charts. Gantt charts show tasks in a fixed line, making it difficult to change plans. Dynamic calendars make it easy to move tasks around, so teams can adapt more quickly.
With integrations such as Slack, HubSpot, and Google Workspace, Jira is highly customizable, giving business teams flexibility and control in managing their work efficiently.
Plans
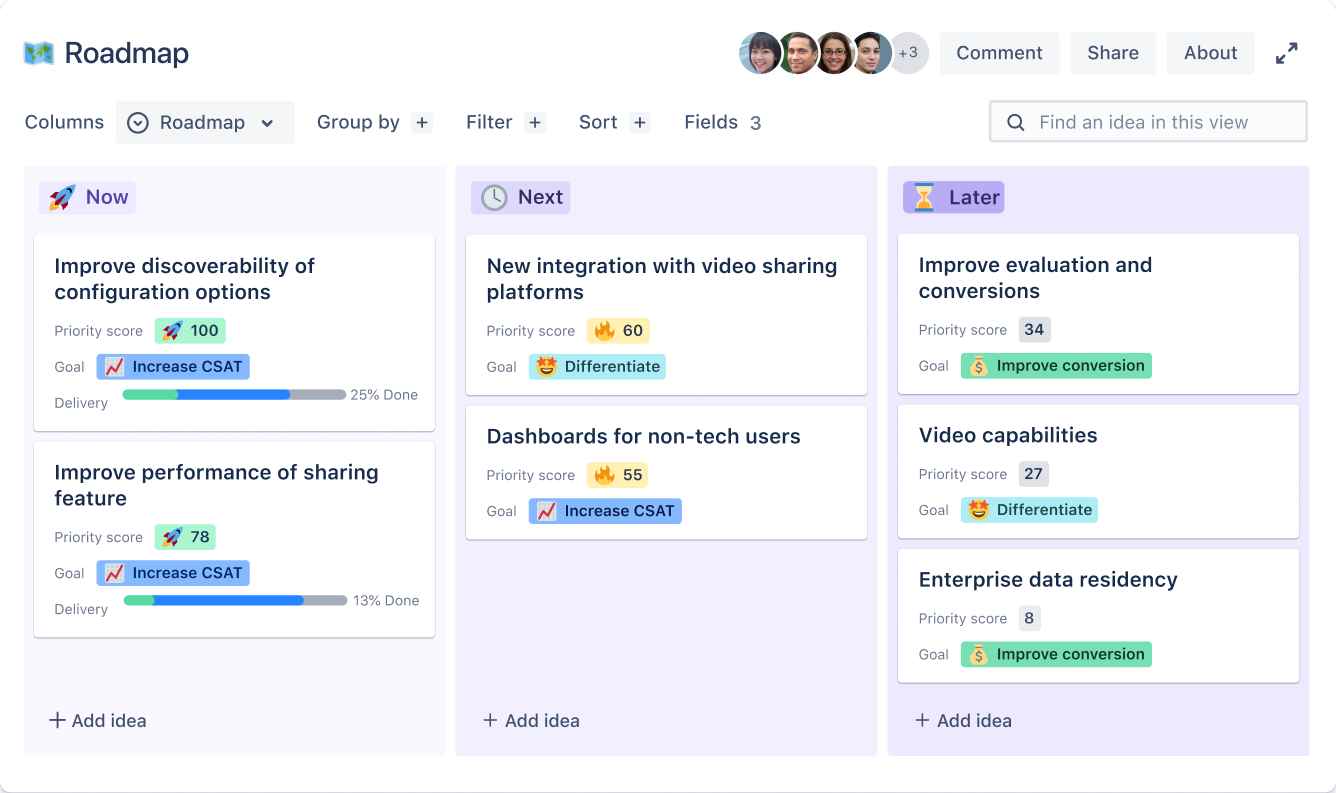
Plans, available in the Premium edition of Jira, is a powerful tool for planning, tracking, and gaining insights into complex projects, especially for distributed teams.
Unlike traditional Gantt charts, it handles intricate scenarios with multiple teams, projects, and dependencies, offering a high-level view of work across teams.
Custom fields and labels categorize work, enhancing visibility and tracking. It simplifies dynamic planning, adapting to reorganizations or shifting priorities without manual adjustments. Integration with multiple Jira boards, projects, and filters allows customized planning.
It's a versatile and more robust alternative to Gantt charts, providing teams with efficient project management tools and clear progress visibility.
Create Gantt charts with Jira Software
Jira has a robust selection of agile project management features that support the needs of any team, such as dealing with complex timelines. More dynamic and robust than a Gantt chart, Jira makes it easy for teams to organize work, stay aligned, and build better products.
Jira Plans, available in the Premium edition of Jira, enhances your planning with data-driven outcome forecasts. For teams seeking further diversification, Jira offers tailored solutions to meet specialized project management needs of business and product teams.
Gantt chart examples: Frequently asked questions
What types of projects are suitable for Gantt charts?
Gantt charts are well-suited for various projects, including business plans, product management, and design projects. They offer a visual and organized way to outline tasks, allocate resources, and establish timelines, making them valuable tools for managing various project types effectively.
Can you use Gantt charts for team collaboration?
Yes, Gantt charts are a valuable tool for team collaboration. They provide a clear visual representation of project timelines, tasks, and dependencies, making it easier for team members and stakeholders to coordinate efforts, track progress, and communicate effectively throughout the project's lifecycle.
What software can I use to create Gantt charts?
If you're aiming to create Gantt charts, consider using Jira as your go-to platform. Jira excels in offering features for dependency mapping, team collaboration, and real-time project tracking, making it ideal for handling complex projects.
Get started for free with Jira and explore Gantt chart functionalities as well as other planning tools.